Software tests
| TESTS | TYPE | Organization |
|---|---|---|
| Security | System intrusion | PSNC |
| Hacking | ||
| Data privacy | ||
| Compatibility | Back-end API | CESCA, GRNET, RNP |
| WebDAV clients | ||
| OS / Browser | ||
| Mobile platforms | ||
| Performance | Load | PSNC, CESNET |
| Volume | PSNC, CESNET | |
| Stress | PSNC, CESNET | |
| Acceptance | Long distance latency | AARnet |
| User Interface - Webdrive | SWITCH, Uni.Porto |
Basic performance tests by CESNET
Multi-VM setup: 2 nodes running patched Voldemort instances forming a Voldemort cluster, 1 node actually running the application and 1 node used as a webdav client for testing.
Storage: for the data was provided by NFS share mounted on application node. The NFS server was running on another, separate node.
All these VMs resided on single physical host (12x Intel Xeon X5650 @2.666 GHz, 48GB RAM, SGI disk array used as datastore for VMs, connected through iSCSI to hosts) running VMware ESXi 5.0.0. The VMs (Ubuntu 12.04 LTS with latest updates) were configured with 1 vCPU, 1024MB RAM and 15GB disk storage, connected to vSwitch with 1Gbit virtual NICs. All the traffic between the VMs was therefore going only through the host, with acceptable speeds.
cloud@clouddriveTest:~$ time iperf -c clouddriveapp1.du1.cesnet.cz -i 1 -n 1G
------------------------------------------------------------
Client connecting to clouddriveapp1.du1.cesnet.cz, TCP port 5001
TCP window size: 23.5 KByte (default)
------------------------------------------------------------
[ 3] local 195.113.231.237 port 48934 connected with 195.113.231.236 port 5001
[ ID] Interval Transfer Bandwidth
[ 3] 0.0- 1.0 sec 384 MBytes 3.22 Gbits/sec
[ 3] 1.0- 2.0 sec 574 MBytes 4.81 Gbits/sec
[ 3] 0.0- 2.1 sec 1.00 GBytes 4.06 Gbits/sec
real 0m2.144s
user 0m0.016s
sys 0m0.604s
These files were uploaded directly to the CloudDrive application using cadaver WebDAV client.
Side note: You can “script” cadaver, you have to supply the credentials using ~/.netrc file (more info: http://www.mavetju.org/unix/netrc.php) and create a file listing commands you would otherwise type into cadaver’s interactive CLI (--rcfile parameter, more: man cadaver).
The output of the uploads looks like this:
cloud@c time cadaver --rcfile=cadaverScript.txt http://clouddriveapp1.du1.cesnet.cz:9090/test/
Uploading testfile to `/test/testfile':
Progress: [=============================>] 100.0% of 104857600 bytes succeeded.
Connection to `clouddriveapp1.du1.cesnet.cz' closed.
real 0m13.859s
user 0m0.008s
sys 0m0.116s
cloud@clouddriveTest:~/test$ time cadaver --rcfile=cadaverScript.txt http://clouddriveapp1.du1.cesnet.cz:9090/test/
Uploading testfile1G to `/test/testfile1G':
Progress: [=============================>] 100.0% of 1048576000 bytes succeeded.
Connection to `clouddriveapp1.du1.cesnet.cz' closed.
real 2m18.505s
user 0m0.128s
sys 0m1.340s
As you can see, the application processes the upload at around 7.2Mbytes/s speed. Important thing to note : the application is CPU-bound and during the tests used 99% of available CPU time on the VM.
You can see the system statistics(cpu, i/o, mem, interrupts, context switches and more) captured during the 1GB file upload in the attached dstat.xlsx file (this is cleaned-up csv file generated by dstat).
In an effort to understand why the processing speed is only around 7.2 Mbytes/s I dug deeper. I ran a Java profiler (the CloudDrive application is written in Scala, but it compiles into Java bytecode and is run in the JVM) VisualVM on the running application during the processing/upload of 1GB file.
First things first. Java installed on the application node was openjdk-7-jre. For profiling I ran the application in JVM with these parameters, to enable JMX connections for profiling (more: http://stackoverflow.com/questions/10591463/why-wont-the-visualvm-profiler-profile-my-scala-console-application?rq=1):
java -Xmx512M
-Xss2M -XX:+CMSClassUnloadingEnabled
-Dcom.sun.management.jmxremote=true
-Dcom.sun.management.jmxremote.port=20000
-Dcom.sun.management.jmxremote.ssl=false
-Dcom.sun.management.jmxremote.authenticate=false -jar
./sbt-launcher.jar run
For profiling I installed VisualVM 1.3.2 and followed this tutorial (http://www.codefactorycr.com/java-visualvm-to-profile-a-remote-server.html) + added JMX connection. From there I captured the metrics for CPU during the processing. Profiler output in XML format is attached.
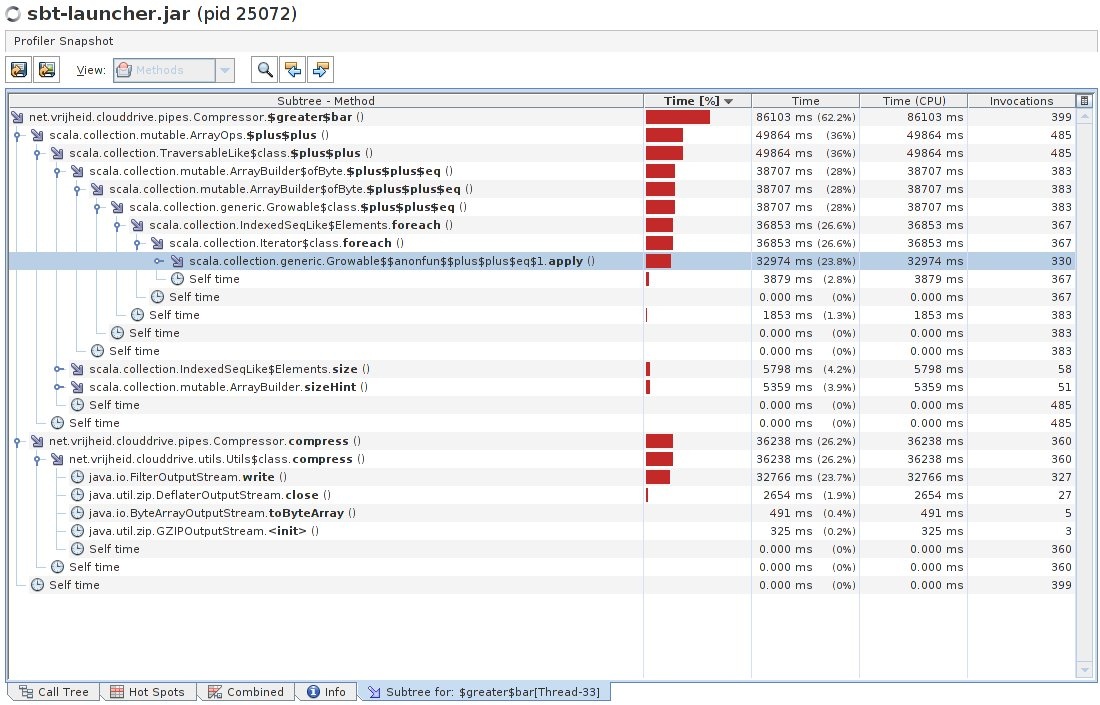
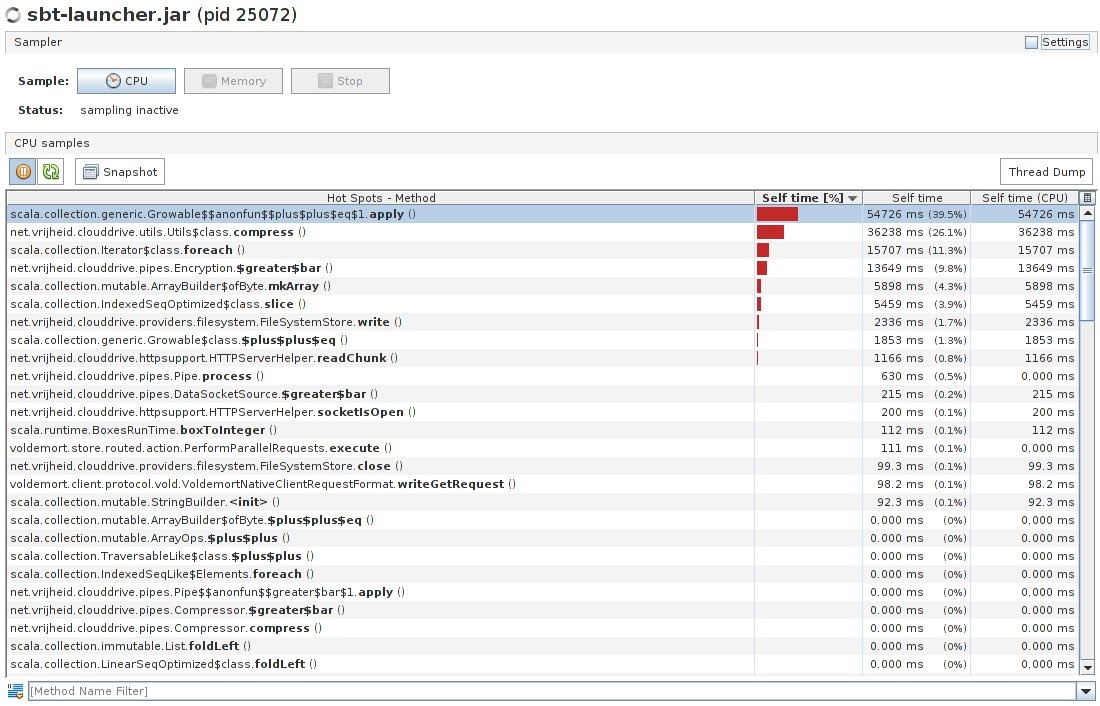
Also the images of CPU hotspot methods and the Compression class subtree from the profiler are attached. As you can see in the hotspot image, most of the time is spent in compress() method and ++ equals 1.apply (Scala operator method?). In the subtree image you can see these two methods expanded with a part of their call trees.
My knowledge of Scala is pretty limited (I am fairly comfortable with Java, but I have no experience with Scala specifics) but from what I could deduce, the hotspots are in “>|” method definition in https://github.com/VirtualCloudDrive/CloudDrive/blob/master/src/clouddrive/src/main/scala/pipes/Compression.scala , which takes care of compressing the data with gzip algorithm. For comparison, when I tried to compress the same files used for application testing, it took less time (obviously, the application has to do encryption on the data and many other tasks):
root@clouddriveApp1:~# time gzip -c testfile > compfile
real 0m4.751s
user 0m4.136s
sys 0m0.120s
root@clouddriveApp1:~# time gzip -c testfile1G > compfile1G
real 0m59.194s
user 0m41.927s
sys 0m1.332s
Well that’s all for now, I hope these findings are useful.
Comments by Maarten:
Excellent and as per my findings. Note that the application scales horizontally per vCPU and across multiple WebDAV servers. ~60Mbit for application level encryption and compression on one vCPU is not too bad - on a quad core you can probably triple that. Also, if storage space is cheap, just turn off compression. To really test and see the difference, turn off encryption as well. It should multiply by a factor 4-8.
I'm also happy that you can run these uploas with this amount of memory: the I/O and buffering all works and gets flushed as it should. The methods you mention >| are essentially "pipe methods" in every functional class (compression, encryption, metering ,….) so it's logical that they show the performance hit: these are the one doing the work.
Bug reports/Feature requests
In addition to the ones on Github https://github.com/VirtualCloudDrive/CloudDrive/issues
| ID | Organisation | Bug/Feature |
|---|---|---|
| 1 | CESCA | Searches are key sensitive (key insensitive maybe more interesting) |
| 2 | CESCA | Searches should include filenames (including directories) |
| 3 | CESCA | If you copy a tagged file, the tags are not being propagated to the copy. And that would be nice. |
| 4 | FCCN | Webdrive - I find it confusing to have the same icon for adding a directory and to upload a file |
| 5 | FCCN | Webdrive - directory navigation - it would be nice to show where we are at directory tree. |
| 6 | FCCN | Webdrive - an upload progress bar would be nice, although I guess for large files one could use the webdav client |
| 7 | FCCN | For the production version I suggest that the applications ensures strong passwords, and to well warn the user that it doesn't need to be the same password as the regular password that belongs to the login that is being reused. I guess it's not so easy to test that they are different passwords |
| 8 | Uni. Porto | To provide Name or ID of logged user on pages |
| 9 | CESCA | Jclouds API on the back-end |
| 10 | RNP | OpenStack Swift S3 API support on the back-end |
| 11 | HEAnet | Administrative web interface for sysadmin |
| 12 | CESCA | No federated problems, but my account says I'm using -199.522 MB of 10 GB (0 %). And there is actually nothing. |
| 13 | Scre | Do encryption in blocks, not the entire file at once. |

